
Introduction challenge of Classifying SpaCy’s ORG Named Entities with Statistical Text Analysis
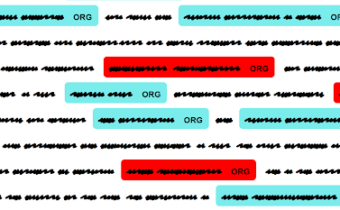
Recently, we were tagging a lot of texts with spaCy in order to extract organization names. We faced a problem in Text Analysis: many entities tagged by spaCy were not valid organization names at all. And it wasn’t actually the problem of spaCy itself: all extracted entities, at first sight, did look like organization names. The result could be better if we trained spaCy models more. However, this approach required a large corpus of properly labeled data which should also include a proper context. So we needed a simpler solution to filter out the wrong data.
The approach we decided to try to solve this problem was based on simple considerations: perhaps, if we looked into the texts, there might be some list of words that are used more frequently alongside organization names. For example, words like corporation, ltd, co., Llc, foundation, group, etc. What we needed was:
- A big enough list of those words for better data quality
- To be sure that these words really occur in the real world
Collecting Word Statistics
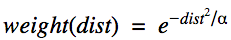
To test our hypothesis, we collected frequencies of separate word usages alongside a few manually labeled company names. We should mention here that we actually tried two approaches. The first one was directly counting the number of mentions of a specific word around a specific named entity. However, after we built the model with this kind of data, it turned out that such kind of model does not perform well. It barely passed the 50% precision threshold and lost recall to nearly 40%. So we modified this approach and it really showed better results.  To improve our approach we took into account distances between words. Here’s how we did it: we still collect the frequency of a word, but we also collect the weighted frequency (weight) of this word. The weight was defined in the following way:
where dist is an integer distance measured in a number of words between a word and a named entity, α — parameter, increasing or decreasing the speed of words weight loss for higher distances. After experimenting with a small set of examples, we chose α to be 15.
Therefore, if a word is often close to a named entity, its weighted frequency will be relatively high, and in the opposite case — low. We also decided to ignore words that are more than 30 words away from the named entity, since they are unlikely to be related to this named entity. Here is the code in Python with which we collected stats for all separate words. It can be slightly improved, but we decided that it is good enough for one-time use.
Note, that nes here is a list of two-element tuples, where the first element is a named entity text itself, and the second element is a binary value denoting whether a named entity is an organization name or not ( we labeled those manually). filenames is a list of those files that we saved while searching for each named entity.
After all the files were processed, we converted the collected stats into pandas DataFrame — words_stats_df(See code below). Then we created two new columns, which were the average weights of words for 1000 usages alongside names of organizations and non-organizations. Then, for each word, we calculated a value words_stats_df[“ir”] — our curiosity rate. The curiosity rate shows how many times on average some word was closer to organizations, than to non-organizations. Of course, a lot of data contains zeros, so when calculating new columns inf or zero can appear. For this reason, we passed the calculated value into a sigmoid function with an offset. Thus, if some word is nearly equally likely to be used with names of organizations and non-organizations, its curiosity rate would be close to 0.5. The interesting words are those that have a curiosity rate close to one or zero.

(We collected a few additional stats for better analysis)
And here is some progress: we can see that such words as subsidiary, merger, corporation, legal, ltd, etc are really at the top of the list. That means, that we are going in the right direction. Now, having this data we need to select a list of words that would be frequently used alongside organization names. A small note: this list should be a list of unbiased words, e.g. must not be anyhow related to company’s products or activities. Otherwise, these words would not be consistent with other organizations.
After passing briefly through this dataset, we chose a list of 100 words that we considered to be characteristic of organizations, and a list of 26 words, that we considered being characteristic of non-organizations:
Here nes is a list of three-element tuples: the first and the second elements are the same, as above for nes, and the third one is a unique named entity id.
We adapted the code from the first code snippet to collect data, so here is the only things that changed:
After the data was collected, we normalized it across the types of statistics:
and split into train\test:
Designing a Model
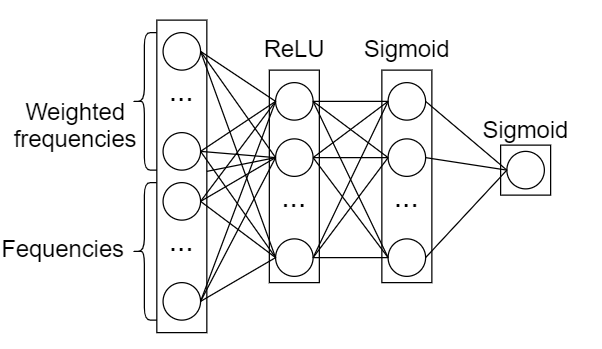
Actually, before trying a machine learning approach, we’ve tried a simple binary regression model with manual weights calculation (using linear regression analysis formulas). But that model did not give any good results, so we decided to try a more complex one — Neural Networks.
First, we prepared data for the model:
[selected_word + “_f” for selected_word in selected_words]
x_train = train_ws_df[cols_order].values x_test = test_ws_df[cols_order].values enc = OneHotEncoder() enc.fit(train_ws_df[“is_org”].values.reshape((-1, 1))) y_train = enc.transform(train_ws_df[“is_org”].values.reshape((-1, 1))).toarray() enc = OneHotEncoder() enc.fit(test_ws_df[“is_org”].values.reshape((-1, 1))) y_test = enc.transform(test_ws_df[“is_org”].values.reshape((-1, 1))).toarray()
Then, we designed the model (we compiled it with an SGD optimizer and a binary_crossentropy loss function):
In fact, we tried a few model architectures. But, judging from the training results, there was some threshold on test data, that the model could not pass. We chose the architecture with the least overfitting.
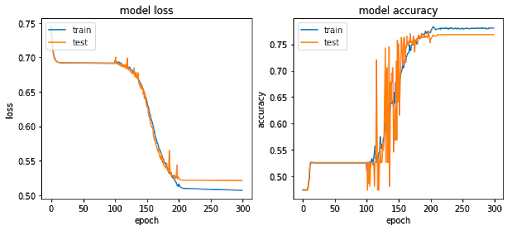
We spotted an interesting thing while training the model: regardless of the architecture, the model wasn’t converging with a constant learning rate. It was converging only if we had first trained it for a few epochs with a low learning rate (epochs 1–100), then for a few epochs with a high learning rate (epochs 100–200), and then again with a low learning rate (epochs 200–300). If we kept a constantly low or high learning rate from the beginning, the model accuracy was stable and no better than random guessing.
Analyzing Results
There might be a few major reasons why we did not achieve any really high values of precision or recall for the model. Here is a list of those that became obvious after a brief analysis of data and results:
- Small dictionary of selected words. There were organizations, where selected words were used only a few times while the word itself was pretty frequently used alongside other organization names. Thus, a bigger dictionary of selected words might help. It must also include more general words for non-organizations.
- We were focusing on US-based organizations only. Thus, we used only English words and search terms. However, there were a few organizations (nearly 7% of all) that had none of the selected words anywhere around their names. It was due to the fact that the pages returned for those organizations were mostly not in English. So, this factor can be eliminated by means of expanding the language scope with translations of selected words or with different words used instead in other languages.
- More labeled data. We labeled only ~1600 records, ~750 of which were organization names. Including various ways of how an organization name can be presented in a text abstract, this number can be insufficient to achieve high model quality.
- Unbalanced data set. We wanted to select words that are not directly related to the organization’s activities and products. This, however, did not seem to be our best decision. For example, we randomly chose a great company, that was mostly dealing with banks and investments. Therefore, we needed to include a few words related to this activity to get better results from our model.
- More data, in general, This one is doubtful since we collected train\test data from about 5.5GBs of HTML pages, which seems to be a lot. But there are only ~8 HTML pages per one named entity, due to a number of search results that Bing returns by default.
Still, for the price of a lower recall for non-organizations (nearly 70% on the test, which most likely can be enhanced by solving the above-mentioned problems), we got a precision rate of 75%. This is much better than what we would have achieved with only this approach, without the machine learning model (47% accuracy).
Conclusion of ORG Named Entities Engine
The results from the model show that the approach described can be applied for named entity classification or filtering. This might be useful when a model implemented or named entity tagging cannot deal with such complex cases like HTML pages, where not all named entities have a proper text context around them. Read Also First part of this Research Searching for Related Organizations Addresses with Web-Search, spaCy, and RegExes Author: Volodymyr Sendetskyi, Data Scientist MindCraft Information Technology & Data Science
you might also like…
Searching for Related Organizations Addresses with Web-Search, spaCy, and RegExes
Problem Statement in Related Organizations Addresses with Web-Search, spaCy, and RegExes. Recently, one of our clients has contacted us with... Read more
Collecting POI from Cameras Using AI
Motivation why we choose points of interest (POI) Maps Services, like those in Google and Bing, usually provide us with... Read more