
Motivation why we choose points of interest (POI)
Maps Services, like those in Google and Bing, usually provide us with a picture of what the schema of streets and buildings looks like from above. They also give us an ability to check for additional information, like traffic data and points of interest (POI). The problem is that this list of POI is typically limited and does not include specific things like speed limits, bus stops or parking signs.
We decided to create an AI engine that would be able to collect POI right from the street cameras and place them on the map using machine learning. In this article, we will stick with the speed limit signs.
Data for POI
Data Science starts with data. For example, Google API services can provide you with a high-quality street view, but for the sake of simplicity, we decided to use open sources. OpenStreetMap (OSM) and Mapillary.com offer their data under the Creative Commons License.
Point of interest Detection
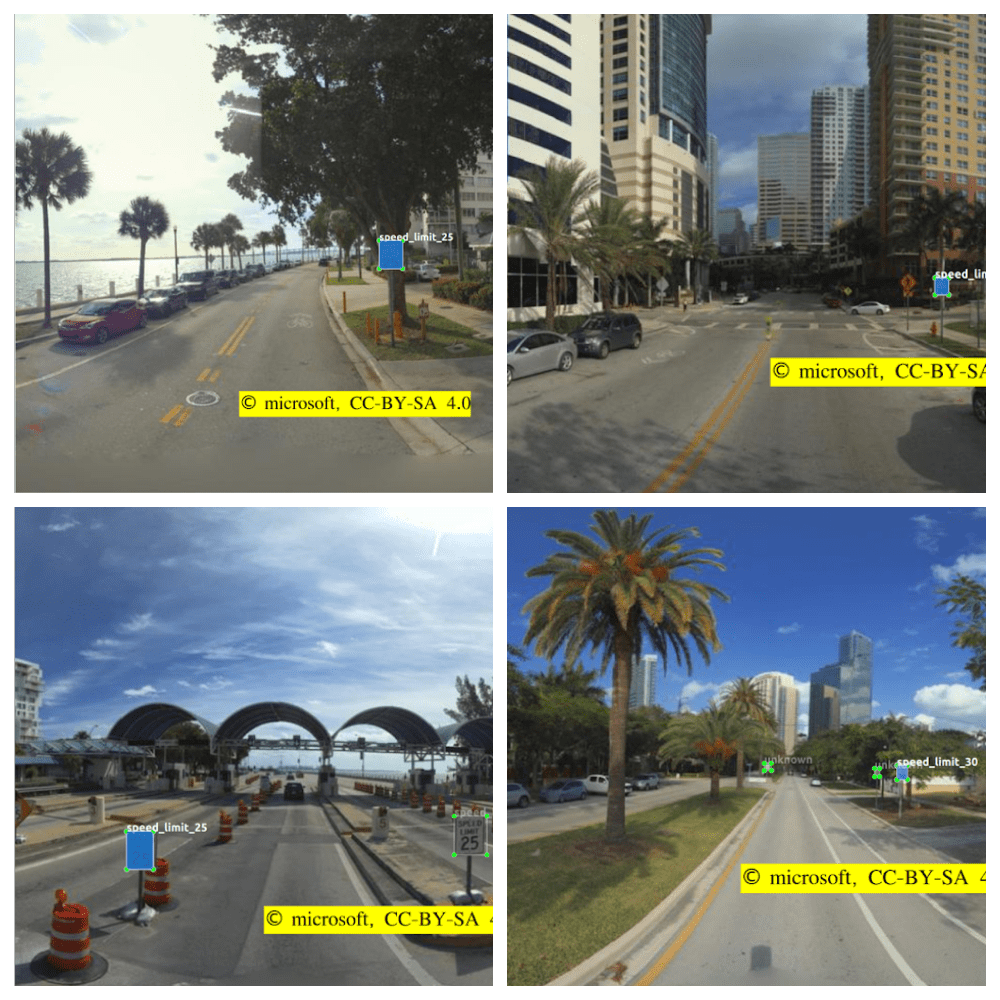
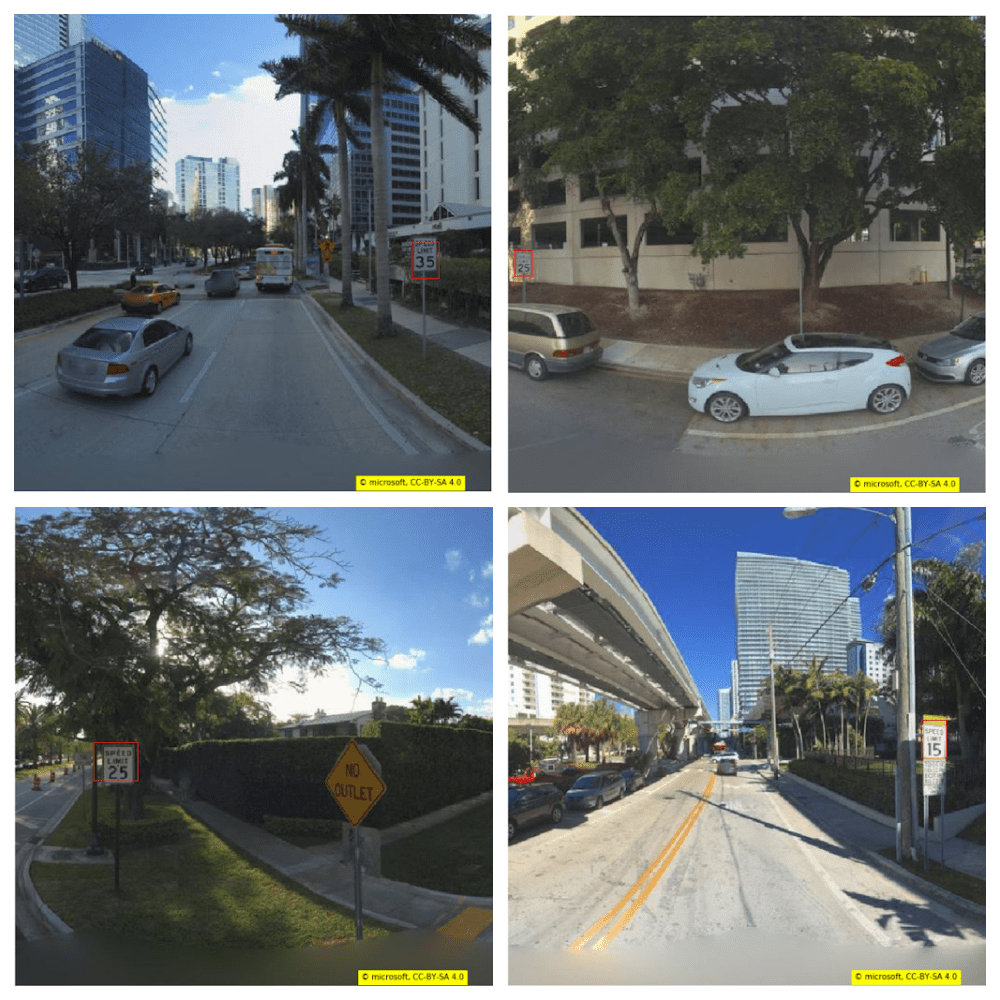
Since we needed to build a map that would collect traffic signs, we took 6,000 street view images and manually labeled a small portion of them (~2K images) using the LabelImg tool. Here are a few samples:
We received the following distribution of traffic signs among those images:
class_name freq
speed_limit_25 405
speed_limit_15 124
speed_limit_35 302
speed_limit_30 185
speed_limit_40 84
We also spotted signs with 15, 55, and 45 limits, but since there were no more than a few of each, we decided to omit them in this PoC. The distribution of sizes (width, height) on average was 16±7, 18±8 pixels for the whole dataset.
Next, we trained a model that would be capable of detecting the traffic signs on images. Well, nowadays there are many frameworks that can efficiently do this job for us. We used ImageAI to train the model on pre-trained YOLO weights. Having split the dataset to train and test (80 / 20), we received the following test part metrics after 10 epochs of training:
Using IoU : 0.5
Using Object Threshold : 0.3
Using Non-Maximum Suppression : 0.5
speed_limit_15: 0.8426
speed_limit_25: 0.8319
speed_limit_30: 0.8200
speed_limit_35: 0.8768
speed_limit_40: 0.8000
mAP: 0.8315
Not a perfect score, but good enough for the purpose of rapid research. After running the abovementioned model on the rest of the dataset, we detected over 1100 speed limit signs.
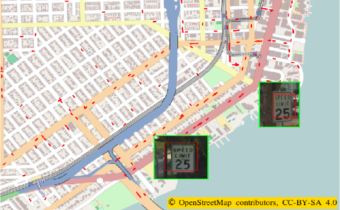
Mapping
What we needed was the exact (or, at least, approximate) lat, lon location of the sign. And here we faced some problems:
- We only had lat, lon coordinates of each panorama in the dataset, and its direction to the north (which could be obtained using the API data), but not the azimuth of the sign itself.
- We did not know the size of a sign. Thus, even having the height of the camera above the ground, we couldn’t directly predict the distance to it.
The first one had an easy solution: the azimuth could be calculated by simply dividing the object (traffic sign) width middle point by the width of the image. This turned out to be a precise enough solution (the error was about ±12 degrees).
The second point was a bit more interesting. Looking at the data, we found an almost linear relationship between the distance and the box’s size. By choosing a simple linear regression model for this problem, it was possible to predict the distance to it with acceptable quality.
In addition, we needed to correctly identify the objects in the case when one sign was detected many times. Well, as we could see, since there was a relatively small number of signs and they were not that widespread in the selected area, a simple clustering by ~10 meters was pretty enough for the final plot to look acceptable.
The Result
By taking into account additional information about the routes at OSM, we could choose a better-than-prl result looked like for 25 and 35-speed limit signs (the others were less frequent):

Conclusion and Future Steps
There were a few problems, stemming from the dataset size and relatively low quality of images. We believe that a 16×20-pixel image would be hard to recognize even for a human. To fix this, we can use a better dataset with a higher resolution. The second issue is a small dataset – the solution is to simply use large datasets and semi-supervised techniques to handle them.
We found that these kinds of engines can be built and used in various business areas that require specific POI collection. And that may not only be a camera view, but also satellite imagery or LIDAR point clouds.
Also, read one more interested work: Searching for Related Organizations Addresses with Web-Search, spaCy, and RegExes
Regards
Team MindCraft.ai
you might also like…
Classifying SpaCy’s ORG Named Entities with Statistical Text Analysis and Machine Learning
Introduction challenge of Classifying SpaCy’s ORG Named Entities with Statistical Text Analysis Recently, we were tagging a lot of texts... Read more

AI and Computational Creativity. Style Transfer as a Basic Example.
Introduction to Computational Creativity With the rise of Artificial Intelligence and Deep Learning technologies, humankind is on the constant lookout... Read more