Subject: Sales Forecasting tool Using Machine Learning
Data Science Areas: Time Series Analysis, Data Processing, Machine Learning, Supervised Learning, Predictive Analytics, Business Forecasting, Business Intelligence, Demand Planning
Architectures: ARIMA
Tools: Python, Pandas, Matplotlib, Statsmodels, Sklearn
Summary: We developed a Python-based Machine Learning solution for Sales Forecasting toll . We do this for a client in the Automotive Industry, the product analyzes Sales Time Series data, predicts buying behavior and helps to boost Business Intelligence in Retail.
The Challenge off Forecasting Tool
Our client is a wholesale retail company dealing in car parts. They addressed MindCraft with a request to develop a Machine Learning model that would predict the sales rate of the items in stock. The solution would help optimize their stock, maximizing revenue per each dollar invested in goods. Since there were tens of thousands of items, the sales forecasting could never be done manually. An automated sales forecasting tool was critical to their Business Intelligence strategy.
Analyzing the Sales Data
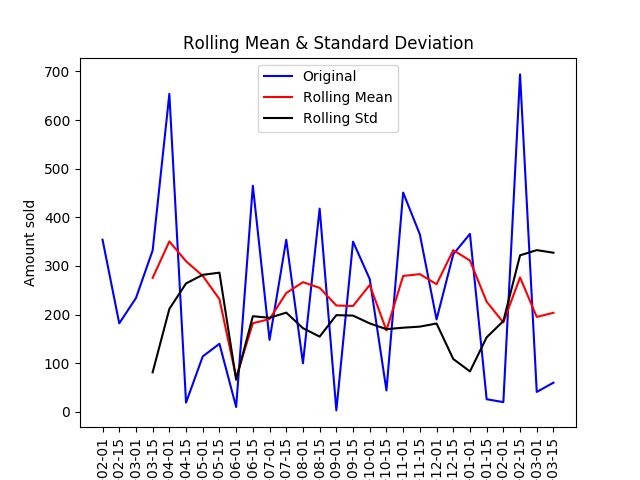
As input data, the client provided us with a sales report covering the 2-weeks period, since the new parts arrive on average every two weeks. The first problem we encountered was unexplainable demand spikes and poor ARIMA performance (for example Test MSE: 47015.61)
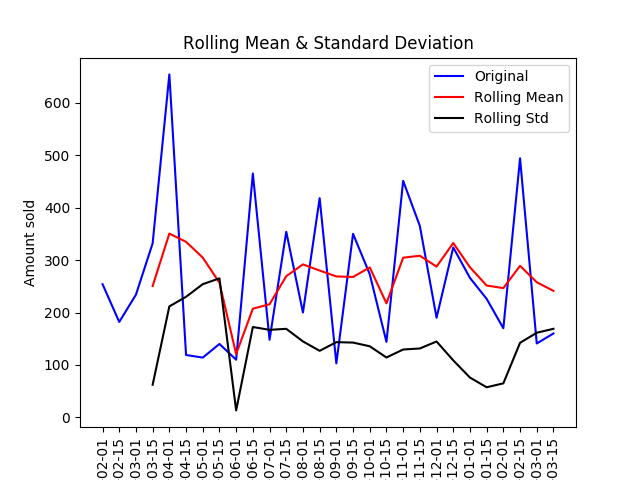
Solution: It turned out that the data received for the analysis displayed the orders by the shipment date. Those spikes are due not to the demand explosion but by logistics issues. So we had to get the data by the order date, not by the shipping date.
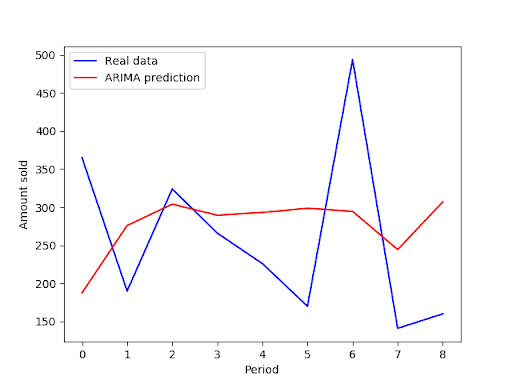
This helped a bit.
predicted=187.664258, expected=365.000000
predicted=275.968372, expected=190.000000
predicted=304.023253, expected=324.000000
predicted=289.578628, expected=266.000000
predicted=293.183042, expected=226.000000
predicted=298.595765, expected=170.000000
predicted=294.670953, expected=494.000000
predicted=244.436785, expected=141.000000
predicted=306.989763, expected=160.000000
Test MSE: 14764.579
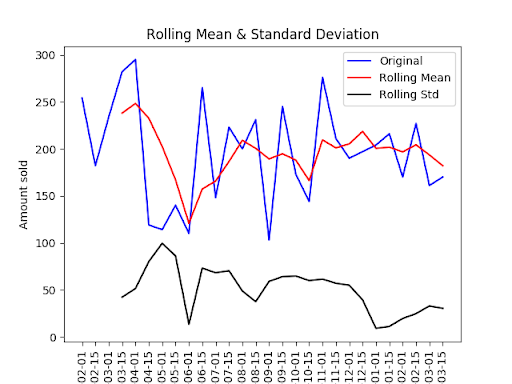
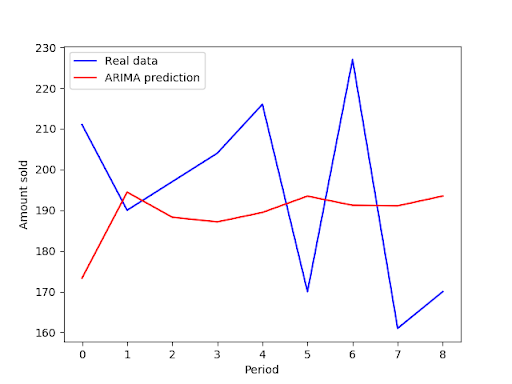
Then, we found that there are a few major customers who keep their own stock and make significant orders once they need their stock resupplied. So, we removed those customers from our data. This helped to get better results.
predicted=173.332428, expected=211.000000
predicted=194.437744, expected=190.000000
predicted=188.282736, expected=197.000000
predicted=187.130092, expected=204.000000
predicted=189.451986, expected=216.000000
predicted=193.459978, expected=170.000000
predicted=191.214602, expected=227.000000
predicted=191.074613, expected=161.000000
predicted=193.483130, expected=170.000000
Test MSE: 643.425
The Results
In this particular case, we were able to achieve around 20% of the average deviations between our prediction and the real amount sold. This would be close to the Inventory Turnover Ratio of 80% in two weeks. Even though we have a significantly higher average deviation in the whole dataset, a prediction that gives 75% deviation in two weeks period is still very good. It will result in a 50% monthly turnover and an annual turnover of 6 which is above the industry average.
A Machine Learning system we developed for the customer can help achieve a significant Inventory Turnover Ratio and thus increase revenue per dollar invested in-stock items. This approach applies to any retail business, helping retailers tackle the Time Series data, predict sales of any product in stock and boost the general Business Intelligence.
Read Also:
Predictive Sales Analytics Tool for Special Offers Evaluation
Regards
Team MindCraft


