
Introduction to Point Cloud Data
In recent years, there was great progress in the development of LIDAR detectors that resulted in huge amounts of raw data. LIDARs are now more accurate and provide a much higher resolution than even 10 years ago. Aerial-based LIDARs have become an efficient method for receiving information about the environment. Nevertheless, the data you get is in fact only a collection of sparse points that may provide some nice visualization but require extensive processing when it comes to more practical purposes. Unfortunately, as of now, the progress of computer vision mostly concerns structured two-dimensional data (photo, video). The current methods do not generalize to multidimensional sparse data like Point Cloud that we receive after a basic LIDAR data pre-processing. Extensive research is being done in the field. We
should particularly mention PCL – a graf of libraries developed by a great international community to provide instruments for both 2D and 3D data for a wide variety of applications. Unfortunately, at the moment it is not an easy task to apply the library to some solution of interest. It often means that you have to dive into the library too deep. It makes sense for production-grade products that need high scalability. But it may be too costly for a PoC development. Therefore, we decided to try what can be done with point cloud data using a simple approach and pretty standard Python libraries (PCL can be used from Python but only so far, since only small subsets can be integrated seamlessly).
Data for the Experiment
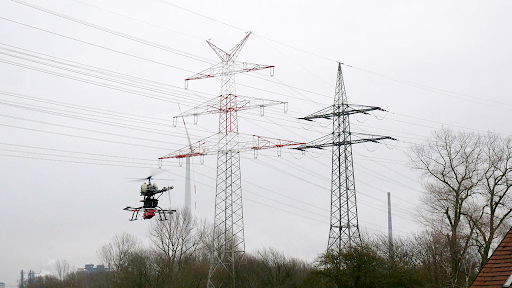
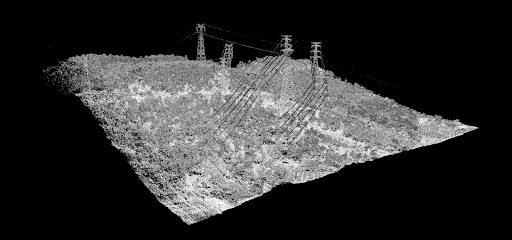
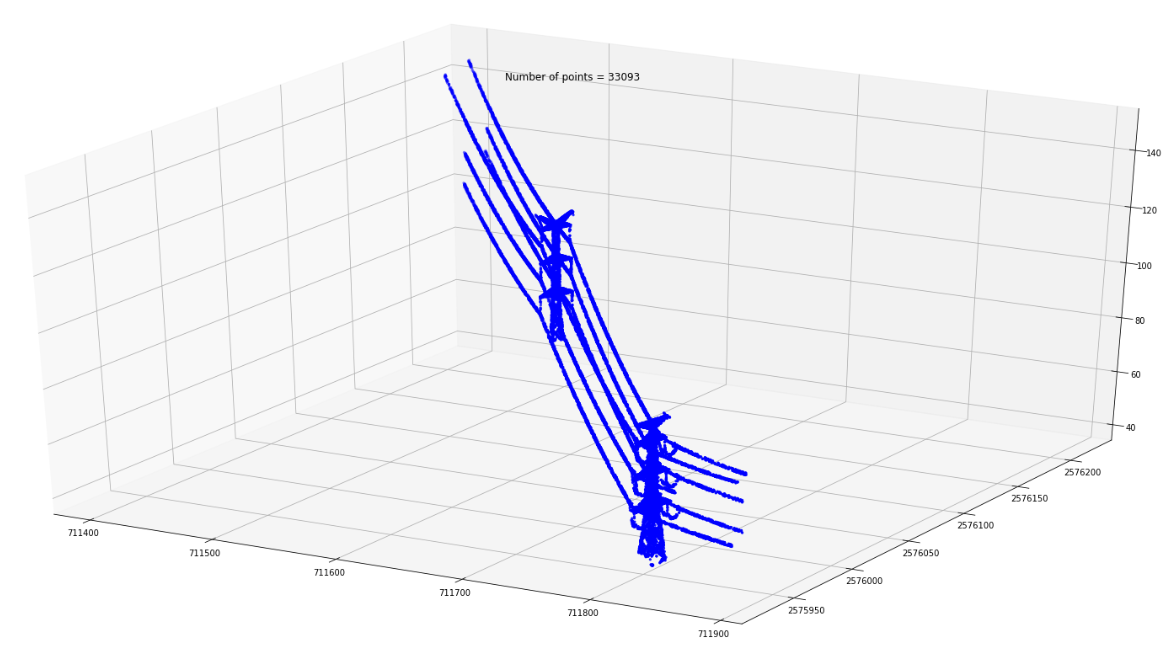
As an example let’s use the data generated by an aerial-based LIDAR for the detection of power lines. Power lines are often clearly visible in point cloud visualization. However, mapping the points that belong to a power line requires a lot of manual efforts. On the other hand, simple geometrical consideration may provide us with means to greatly simplify or even automate such processing.
The power line on the picture is actually a collection of points which form certain geometrical patterns. To simplify further categorization, I decided to check how we can form clusters out of these points.
Software Used for the Experiment in Point Cloud Data
I will use NumPy, Sklearn, Laspy and SciPy libraries for the purpose of cluster formation and matplotlib for visualization.
Laspy is great for handling point cloud data in Python. We read point cloud data from a las file and check the shape of the actual dataset.
(5942479, 3) — our point cloud consists of 5942479 points. It is not enough if you want to get to small details. But the number is too big if you try to convert this DataFrame into a three-dimensional NumPy array, as in this case, we will get a huge 5942479³ = 2.09*10²⁰ array. It will use an enormous amount of RAM for the storage of really sparse data. The obvious thing to do is to use a NumPy sparse array. But as a matter of fact, a sparse array works great for 2D but fails with 3D data. Matrix manipulation functions are not fully compatible with sparse 3D matrices. We have to stick to working with a DataFrame instead of a NumPy array due to memory requirements.
Eliminating Out-of-Scope Points
We need to find a method to eliminate those points that are not power lines. Power lines are placed high above the ground for safety reasons and to ensure their optimal performance. But for the rugged terrain, we have to take into account that some ground points can be higher than power lines in different parts of the image due to the ground incline. To avoid this let’s divide our point cloud to small vertical parts.
With the help of this simple approach, we can greatly reduce the number of points in the cloud in no time even using moderate computing power. In our case, it was the reduction of the number of points by an order of magnitude in 3 minutes — not bad for a few lines of code, given that we made no real efforts for any optimization.
Now we’ll be using a much smaller filtered dataset.
Exploring Our Data for Point Cloud
Let’s explore our data:
During my experiments, I try to use the 4D representation of data (X, Y, Z, and intensity) but the results do not improve over 3D (X, Y, Z) so let’s stick to the latter subset of data.
Data Normalization
As you can see, the values are in different ranges. For better results, we should normalize the dataset.
Clustering the Points That Are Geometrically Close
Now we are ready to process our data. Our power lines are actually spatial clusters of points so it is natural to try a clustering algorithm. After a short investigation, I found that DBSCAN provided by the Sklearn library works best out-of-the-box.
Now let’s visualize our results.
Visualization
Most of our points were grouped into clusters. Let’s see what it looks like in practice:
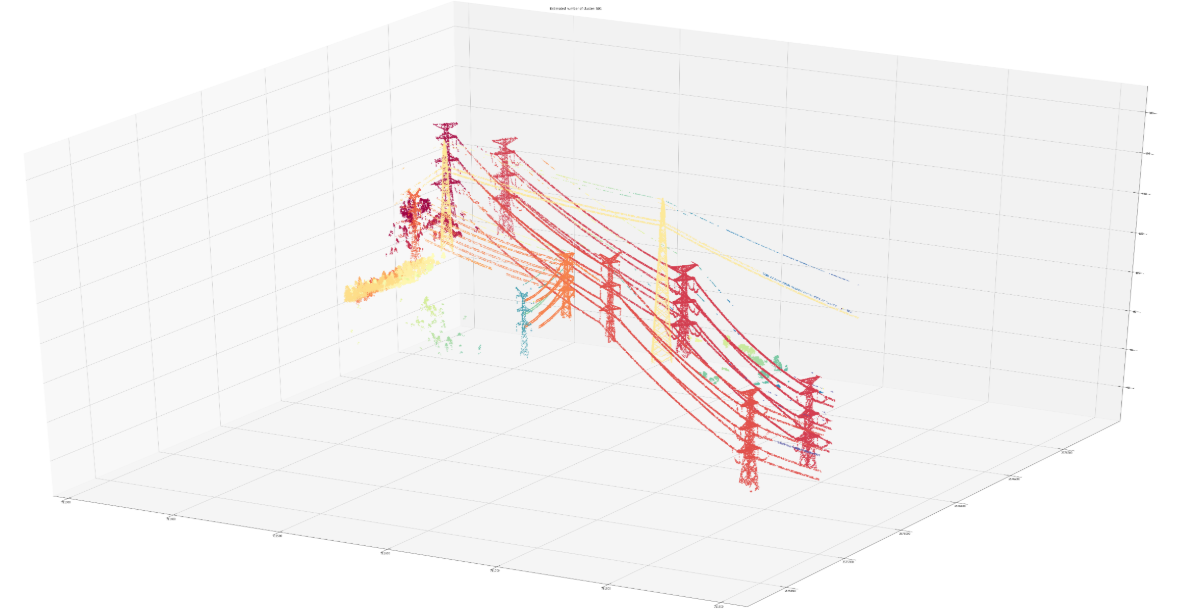
It is clear now that simple geometrical consideration and a pretty standard clustering method help us to simplify the point categorization using moderate computing resources.
Each cluster of points can be categorized separately if needed.
Results
Our experiment showed that a combination of geometrical consideration and standard Python libraries can result in a significant reduction of efforts needed to categorize raw point cloud data for further usage.
Author:
Alex Simkiv, Data Scientist|Co-founder at MindCraft
Information Technology & Data Science
Read Also:
Object Detection and Counting
you might also like…

Predictive Sales Analytics Tool for Special Offers Evaluation
Subject: Special Offers Evaluation for a Retailer in Automotive, Sales Analytics TollData Science Areas: Machine Learning, Data Processing, Predictive Analytics,... Read more
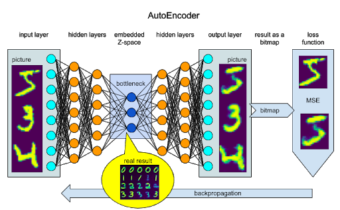
Differentiable Programming – Inverse Graphics AutoEncoder
Intro to Differentiable Programming DeepLearning classifier, LSTM, YOLO detector, Variational AutoEncoder, GAN – are these guys truly architectures in sense... Read more